
Add data-driven decisions to good edtech instincts. Here’s how your edtech solution can help measure its own return on investment.
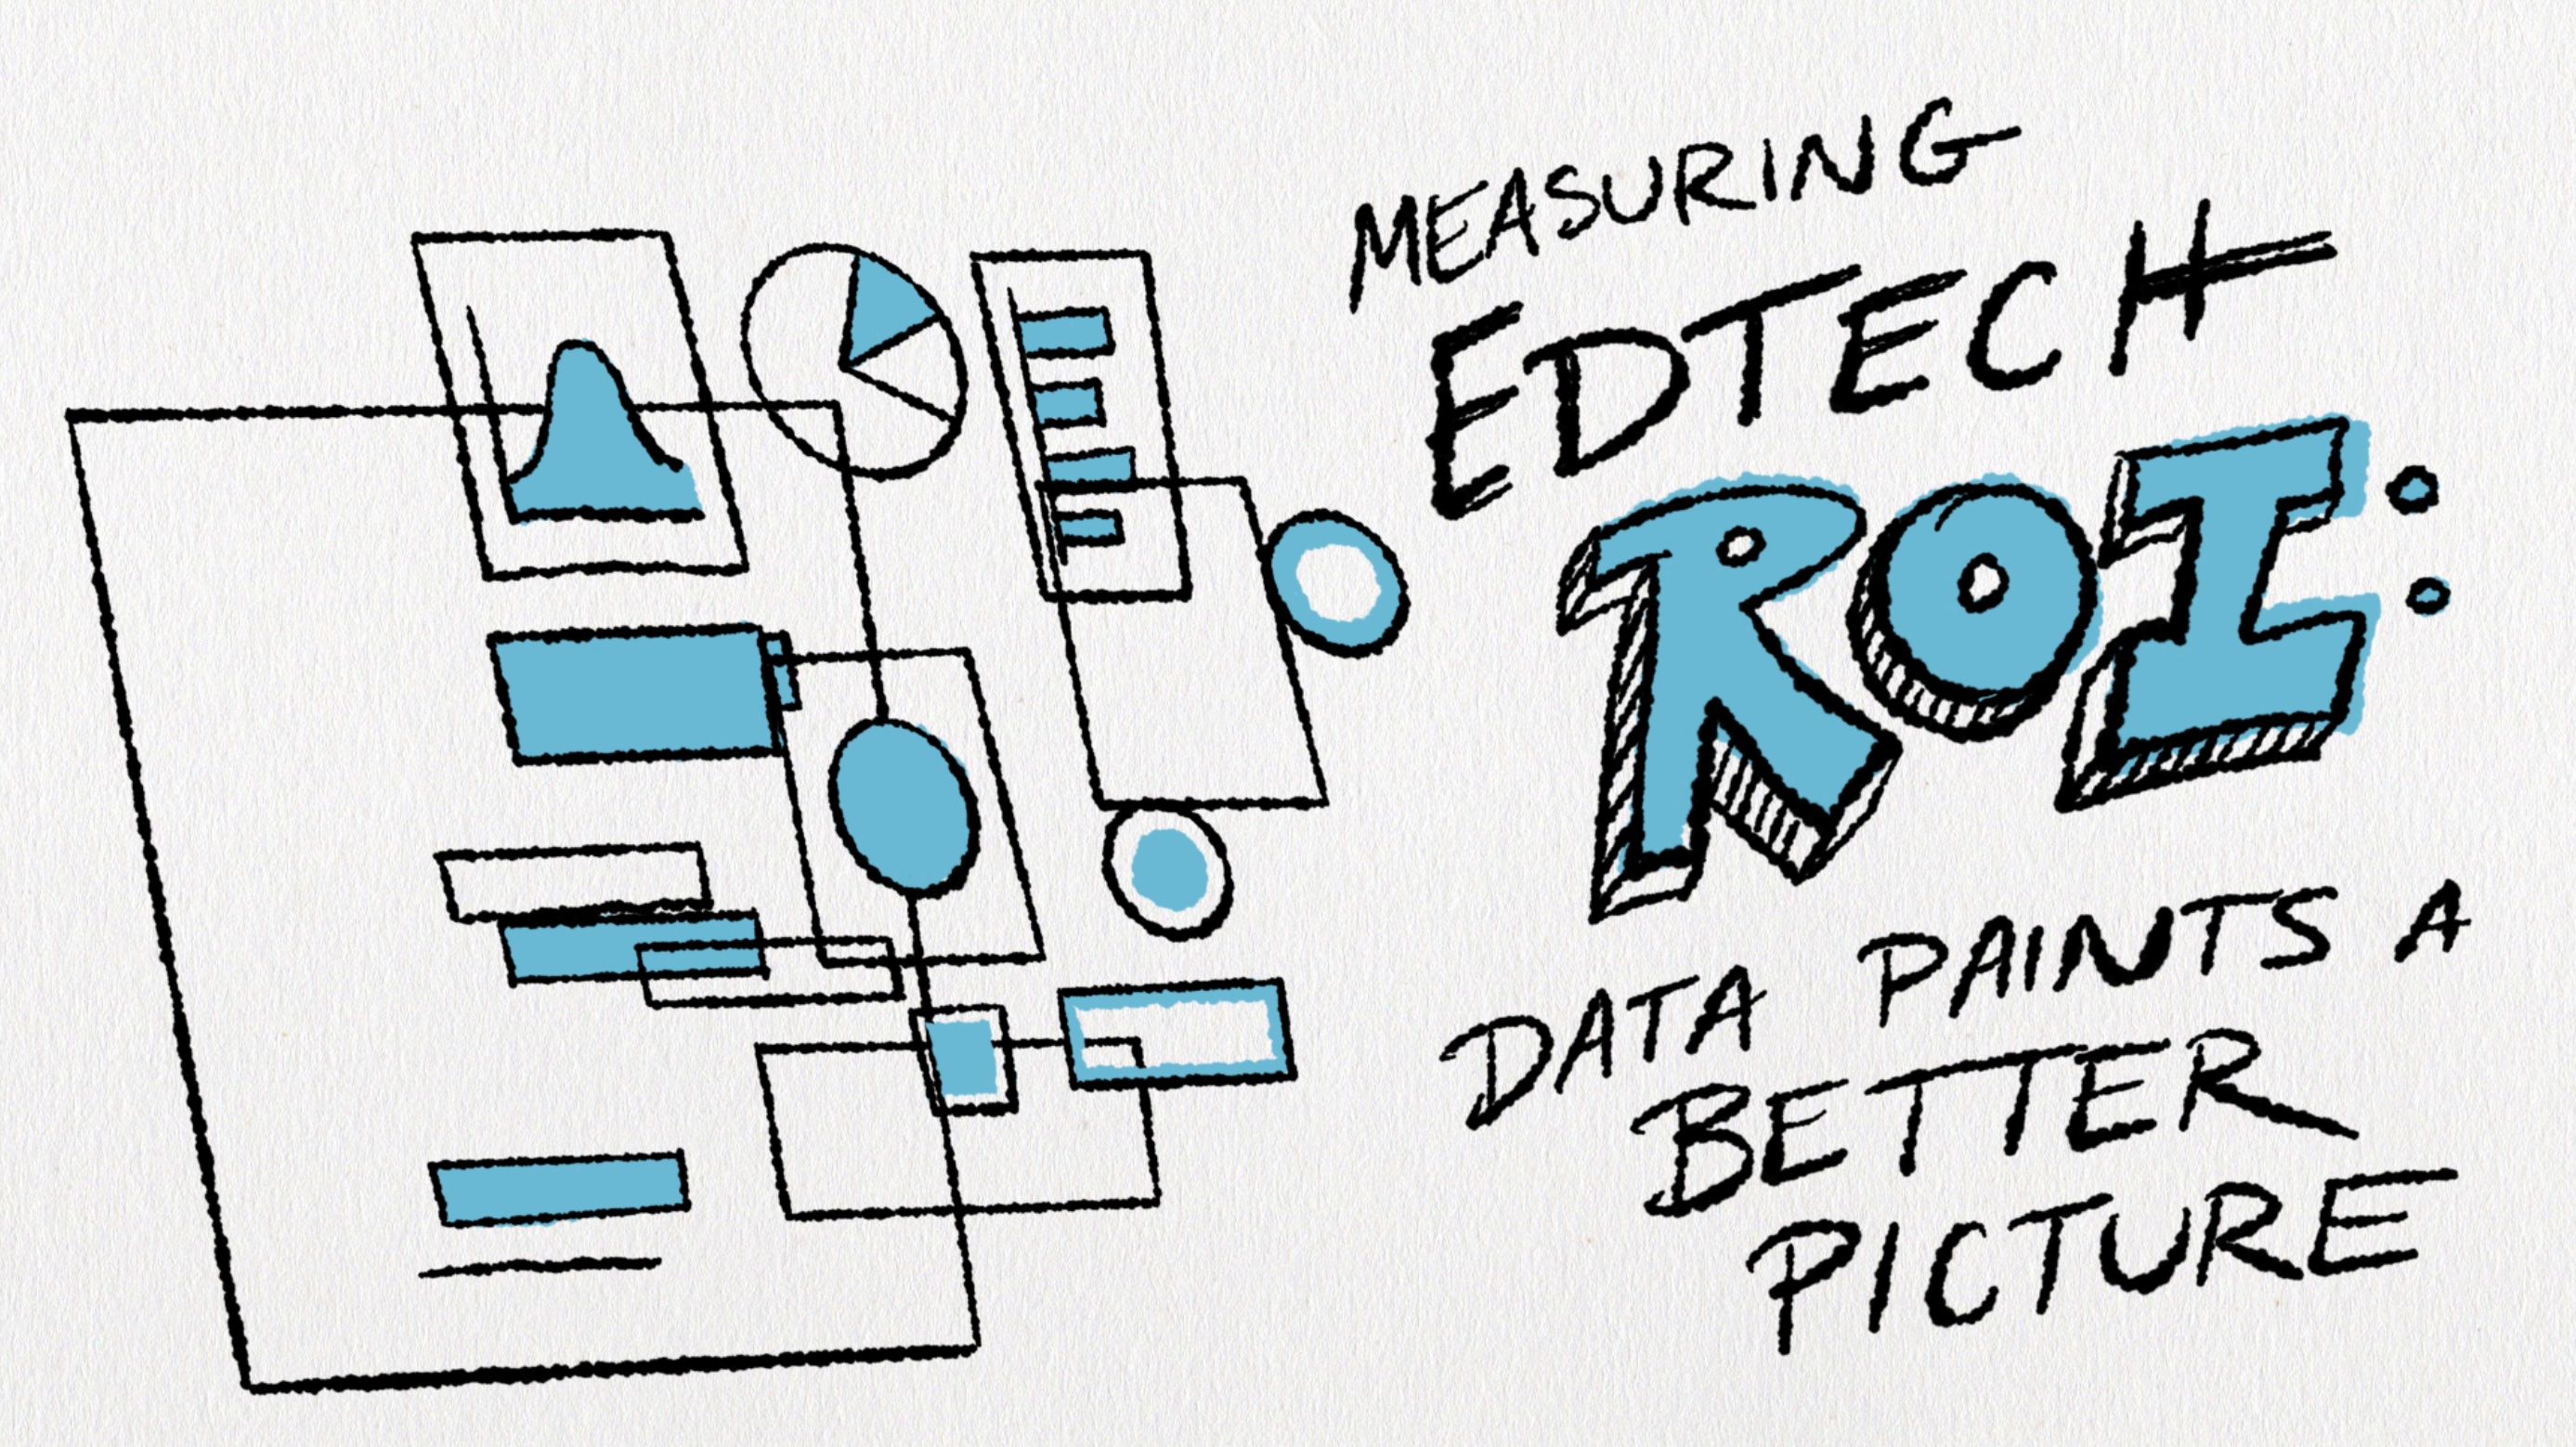
Data is dense but pictures provide instant connection. Visualizations don’t need to be professionally curated to be successful, they need to be easy to understand.
For some solutions, the way users view data is already designed to be displayed in an interactive and visually appealing format. For next-level data visualizations, there are folks on your team today who are gifted at analyzing, synthesizing, and producing graphs, charts, infographics and more. These visualizations help make a complicated story and years’ worth of work into an immediate connection with any audience.
Who benefits from seeing these data visualizations?
- Your board
- Your community, including families and students
- Your product champions instrumental in implementing a new edtech solution
- Your users who might appreciate data showing off their hard work learning a new solution.
One of the best parts of making data visually appealing is engaging the community who has very little insight into the amazing happenings of teaching and learning. Leaders who keep their audience in mind during the process of gathering, measuring, and communicating the return on hefty edtech investments will find more success and foster greater understanding.
Take a look at how the bigger picture develops in the final installment of the Edtech ROI video series.
WHAT'S NEXT FOR YOUR EDTECH? The right combo of tools & support retains staff and serves students better. We'd love to help. Visit skyward.com/get-started to learn more.

|
Erin Werra Blogger, Researcher, and Edvocate |
Erin Werra is a content writer and strategist at Skyward’s Advancing K12 blog. Her writing about K12 edtech, data, security, social-emotional learning, and leadership has appeared in THE Journal, District Administration, eSchool News, and more. She enjoys puzzling over details to make K12 edtech info accessible for all. Outside of edtech, she’s waxing poetic about motherhood, personality traits, and self-growth.